TL;DR

Get backup power and energy gear delivered free with Prime
- Fast, free delivery on millions of items
- Prime Video, Amazon Music and more included
- Member-only deals all year
The U.S. Energy Information Administration estimates that generation from small-scale solar systems rose from 18,812 gigawatt-hours in 2016 to 92,979 GWh in 2025. California produced 37% of the 2025 total, while the national growth rate has slowed since a sharp increase in 2022.
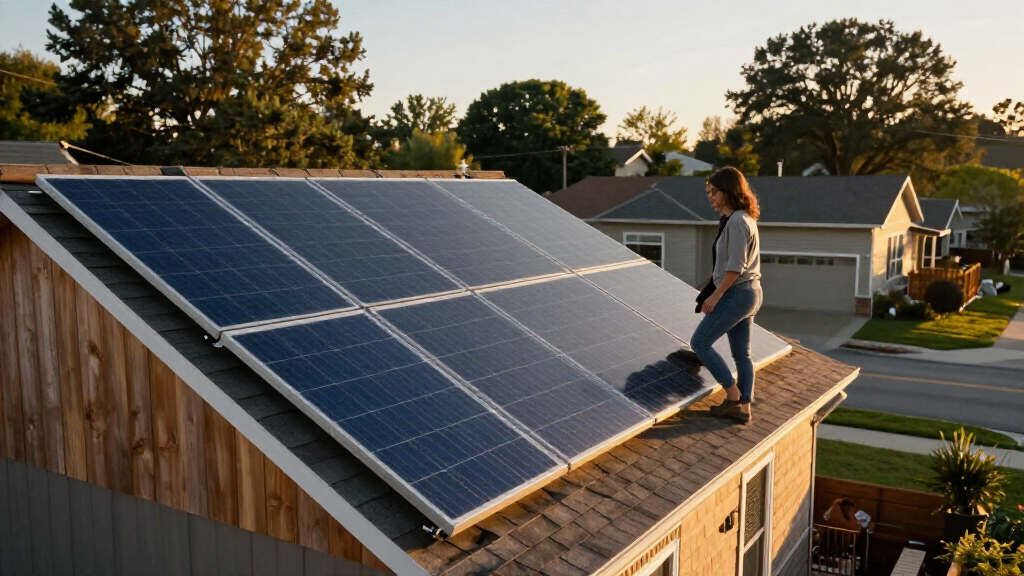
U.S. small-scale solar generation rose from 18,812 gigawatt-hours in 2016 to an estimated 92,979 GWh in 2025, according to an analysis published October 16 by the U.S. Energy Information Administration. The figures cover photovoltaic systems with capacity below 1 megawatt, including rooftop installations, and show a major expansion in electricity generated outside large utility-scale solar plants.
The EIA’s decade comparison indicates generation increased to nearly five times its 2016 level. The agency identifies California, Arizona, Texas and Florida as the four states with the largest small-scale solar output, all in regions with relatively abundant solar resources. New York ranks fifth despite lower solar resources, with growth supported by additional capacity, technology improvements and state incentives, the agency said.
California accounted for 34,411 GWh in 2025, or 37% of the national total. Its rooftop solar generation rose 8% from 2024, as small-scale capacity grew from 18 gigawatts to 20 gigawatts. Arizona ranked second, generating 5,795 GWh, more than 6% of the U.S. total; its output increased 6% in 2025.
Growth has been rapid in other large states, too. Texas generation climbed from 391 GWh in 2016 to 5,408 GWh in 2025, while Florida rose from 205 GWh to 5,198 GWh. The EIA says the pace of national growth has declined since 2022, even as generation continued to increase year over year.
Rooftop Solar Changes the Power Mix
The increase means distributed solar—panels located at homes and other smaller sites—has become a larger source of U.S. electricity. Unlike output from a single large power plant, rooftop generation is spread across many customer systems and can reduce the amount of electricity those customers draw from the grid when the panels are producing power. The EIA figures track generation, not the resulting effect on bills, emissions or grid reliability.
The uneven state totals also show that the expansion is not driven by sunshine alone. California’s share is particularly large, while New York’s fifth-place ranking points to a role for state policies and technology in places with less intense solar resources. Changes in customer incentives can affect installation decisions and, in turn, the amount of generation added to the system.
For energy planners and utilities, estimating output from many small systems matters because those systems contribute electricity across local distribution networks. The EIA says utilities may not know how much rooftop solar is generated on their systems, so the figures are estimates rather than direct readings of every installation’s production.
State Incentives Shaped Installation Growth
The EIA links part of the unusually strong national growth in 2022 to record capacity additions and changes in programs supporting rooftop solar. California’s Net Energy Metering 2.0 program remained available through April 2023 and offered higher compensation for electricity exported to the grid than the later Net Billing Tariff, also called NEM 3.0. Capacity installed under NEM 2.0 was grandfathered into the earlier program, giving customers an incentive to install systems before the new tariff took effect, the agency said.
In Arizona, the EIA points to a 25% state income-tax credit and other incentives for customers who add rooftop solar. Texas and Florida offer property-tax exemptions and other programs, some of which vary by state or utility. New York, New Jersey, Massachusetts and Illinois also have programs that the EIA says support rooftop solar growth in states with lower solar irradiance.
The national year-over-year increase was 25% in 2022, the analysis says. Arizona’s largest annual increase in the period cited came later, rising 22% between 2022 and 2023. These are different measures and time periods: the national 2022 figure is not the same as Arizona’s state-level change.
How Rooftop Output Is Estimated
The 92,979 GWh figure is an estimate, not a direct measurement of every small-scale solar system. The EIA gathers utility survey information on the number of customers with small-scale systems and their combined capacity, but utilities may not know the amount of electricity those systems generate on distribution networks.
To estimate production, the agency uses tools including the National Renewable Energy Laboratory’s System Advisor Model and PVWatts. The EIA says it uses data on commonly used tilt angles and orientations for small-scale systems in California as inputs meant to represent those characteristics in other states. The analysis does not provide a state-by-state uncertainty range, so the precision of individual state estimates is not stated in the source material.
The figures establish the estimated change in generation but do not, by themselves, explain how much came from additional installations versus changes in system performance, nor do they quantify effects on customer costs or emissions. The source also says growth has slowed since 2022 but does not give a single national growth rate for 2025.
Future Output and Policy Changes
The EIA analysis does not announce a new forecast or policy decision. Its next figures would be needed to show whether U.S. small-scale generation continues to rise and whether the growth rate keeps slowing. New annual generation and capacity estimates will also help clarify how changes in state incentives and utility programs affect installations.
In California, the shift from NEM 2.0 to the Net Billing Tariff provides a policy change to watch in later data, while the agency’s 2025 figures already show capacity and generation increasing from the previous year. For now, the latest reported comparison ends in 2025; the analysis gives no 2026 generation total or projection.
Key Questions
How much did U.S. small-scale solar generation increase?
The EIA estimates it rose from 18,812 GWh in 2016 to 92,979 GWh in 2025, nearly five times the earlier total.
What does the EIA count as small-scale solar?
The analysis covers solar photovoltaic systems with less than 1 megawatt of capacity, including rooftop systems.
Which state generated the most small-scale solar power in 2025?
California led with 34,411 GWh, equal to 37% of the national total, according to the EIA.
Why are the generation figures estimates?
Utilities may not know how much electricity rooftop systems generate on their distribution networks. The EIA combines utility survey data with modeling tools, including PVWatts and the System Advisor Model, to estimate output.
Is small-scale solar still growing at the same pace?
No. The EIA says generation continues to grow year over year, but the rate of growth has declined since 2022. The analysis does not give a national 2025 growth rate.
Source: primary
Halloween Picks
halloween
As an affiliate, we earn on qualifying purchases.